Fun with branch misprediction in LLVM test-suite 7zip benchmark
This post talks about my adventure trying to understand the performance of 7zip benchmark from LLVM test-suite and trying to optimize it. This was a part of Denis Bakhvalov’s 2nd Performance analysis and tuning contest. Note that I was not able optimize much. From Denis’s reply to my submission, I had a 3% improvement on his machine with my patch. However I had an awesome time and lots of fun figuring out the problem and learning all the tools/techniques necessary for it. I hope you’ll find my approach useful even though I posted nearly a year later after I did the contest. I want to thank Denis for his blogs on performance and for organizing this contest.
The goal was to understand what was causing the benchmark to be slow on my machine without going deep into the internals of the algorithm. Denis’s blog already talks about how to build the tool so I’m going to dig into how I approached the problem.
Using Flamegraph to find hotspots
Flamegraph is an excellent way to view the results of perf tool and understand which functions your application is spending most cycles (or any cpu event of interest).
I found using LBR for call-graph to be very useful since perf record -g did not produce a proper stack trace. The flag --call-graph lbr works for Haswell+ CPUs. See man perf record for more details.
$ taskset -c 0-1 perf record -a --call-graph lbr -- ./7zip-benchmark b
$ perf script | stackcollapse-perf.pl > out.perf.folded;
$ flamegraph.pl --inverted --reverse out.perf.folded > flame_graph_7zip.svg
The LzmaDec_DecodeReal2 function contained ~48% of samples (cpu cycles) in the generated flamegraph shown below:
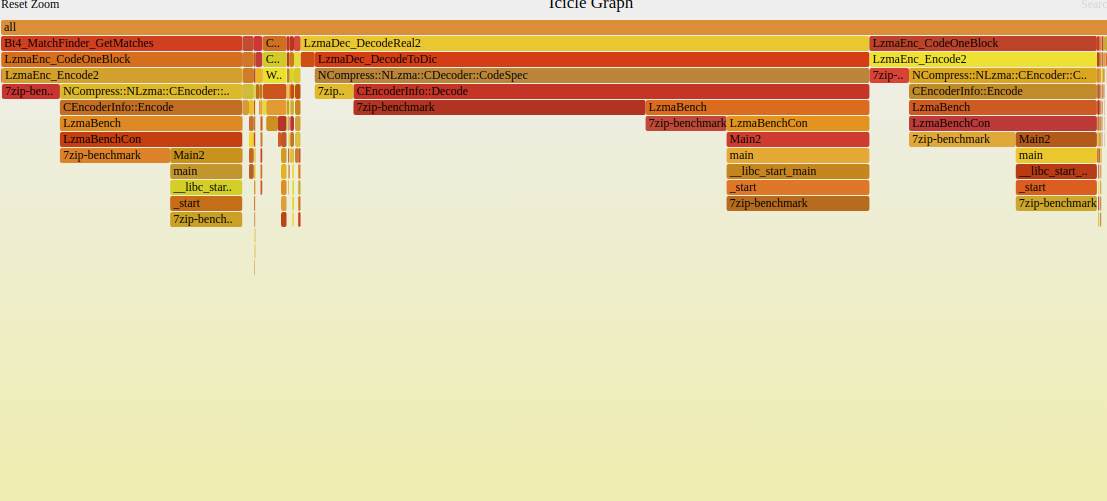
So optimizing this function would definitely be a good idea.
Using toplev/perf stat to understand the bottleneck
I used Andi Kleen’s tool toplev to understand where the bottlenecks in the benchmark were coming from. I used it with -l1 and -l2 flags following instructions from Denis’s blog:
$~/tools/pmu-tools/toplev.py -l1 --core C0 -v taskset -c 0 ./7zip-benchmark b
....

Results:
L1: Bad Speculation
L2: Bad_Speculation.Branch_Mispredicts
Running perf stat also showed that the benchmarks had 12.5% of branch-misses.
$ perf stat taskset -c 0 ./7zip-benchmark b
       6485.984604      task-clock (msec)         #    1.000 CPUs utilized
                 7      context-switches          #    0.001 K/sec
                 0      cpu-migrations            #    0.000 K/sec
            41,060      page-faults               #    0.006 M/sec
    21,004,295,551      cycles                    #    3.238 GHz
    27,397,141,172      instructions              #    1.30  insn per cycle
     3,393,766,125      branches                  #  523.246 M/sec
       424,635,829      branch-misses             #   12.51% of all branches
Data is now showing us that lots of speculative execution done by the CPU had to be discarded because of branch misprediction. Let’s see where and why this is happening.
Using TMAM to pin-point source(s) of branch misprediction
To pin-point the source(in code and in assembly) of branch misprediction using TMAM (see Denis’s blog for details on TMAM), I need to know some details about my CPU and plug it into the TMA Metrics table.
I ran the benchmark on a Broadwell(BDW) Xeon CPU. So plugging the values into the TMA table I could see:
For Bad_Speculation->Branch_MisPredicts, Locate-with = BR_MISP_RETIRED.ALL_BRANCHES_PS
This metric represents fraction of slots the CPU has wasted due to Branch Misprediction. These slots are either wasted by uops fetched from an incorrectly speculated program path; or stalls when the out-of-order part of the machine needs to recover its state from a speculative path.
Measuring BR_MISP_RETIRED.ALL_BRANCHES
perf can be used to measure this event as follows.
$ taskset -c 0-1 perf stat -e cycles,cpu/event=0xC5,umask=0x04,name=BR_MISP_RETIRED.ALL_BRANCHES/ -- ./7zip-benchmark b

7-Zip (A) [64] 9.20  Copyright (c) 1999-2010 Igor Pavlov  2010-11-18
p7zip Version 9.20 (locale=en_US.UTF-8,Utf16=on,HugeFiles=on,1 CPU)

RAM size:     128 MB,  # CPU hardware threads:   1
RAM usage:    107 MB,  # Benchmark threads:      1

Dict        Compressing          |        Decompressing
      Speed Usage    R/U Rating  |    Speed Usage    R/U Rating
       KB/s     %   MIPS   MIPS  |     KB/s     %   MIPS   MIPS
22:    4200   100   4086   4086  |    41025   100   3704   3704
23:    3982   100   4058   4058  |    40461   100   3704   3704
----------------------------------------------------------------
Avr:          100   4072   4072               100   3704   3704
Tot:          100   3888   3888

 Performance counter stats for './7zip-benchmark b':
    21,744,312,236      cycles
       425,049,101      BR_MISP_RETIRED.ALL_BRANCHES

       6.709111910 seconds time elapsed
The next section discusses how the cpu/event and umask values were obtained for my CPU.
Getting masks and event ID for BR_MISP_RETIRED.ALL_BRANCHES_PS
From Intel® 64 and IA-32 Architectures Software Developer’s Manual, Volume 3B: System Programming Guide, Part 2, I could find the required values for my Broadwell CPU. This needed some grepping around in the document.
Table 19-8. Performance Events of the Processor Core Supported by Broadwell

We can see that Event = 0xC5 and umask=04. Note that this event also supports PEBS.
Finding the function with highest mispredictions
Run perf record with the parameters recently discovered. This will sample all branch mispredictions that happen when the benchmark is running and then you can see branch misprediction percentage per function/line.
$taskset -c 0-1 perf record --call-graph lbr -e cpu/event=0xC5,umask=0x04,name=BR_MISP_RETIRED.ALL_BRANCHES/ppp -- ./7zip-benchmark b

#
# Look for function with % highest branch miss
#

$perf report -n --stdio | less
#
#
# Total Lost Samples: 0
#
# Samples: 24K of event 'BR_MISP_RETIRED.ALL_BRANCHES'
# Event count (approx.): 424835858
#
# Children  	Self   	Samples  Command     	Shared Object    	Symbol
# ........  ........  ............  ..............  ...................  .........................................

……………

74.77%	74.75%     	13168  7zip-benchmark  7zip-benchmark   	[.] LzmaDec_DecodeReal2
        	|
         	--74.75%--_start
                   	__libc_start_main
                   	main
                   	Main2
                   	LzmaBenchCon
                   	LzmaBench
                   	CEncoderInfo::Decode
                   	NCompress::NLzma::CDecoder::CodeSpec
                   	LzmaDec_DecodeToDic
                   	LzmaDec_DecodeReal2
You can see that LzmaDec_DecodeReal2 has the highest number of branch misprediction. This correlates with what the flamegraph showed earlier that it consumes more cpu cycles, branch-misprediction might be the what was causing the CPU to spend more cycles. Note that we could also have generated a flamegraph using the perf.data generated from the above run and seen the same function.
Analyzing LzmaDec_DecodeReal2
Now dig into the function:
$perf annotate -M intel LzmaDec_DecodeReal2
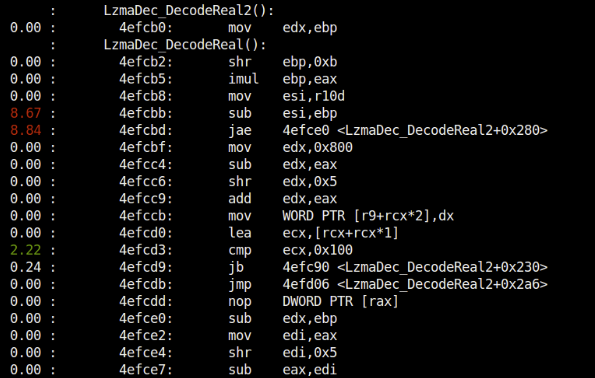
See the lines with ~9% branch mispredictions in the function LzmaDec_DecodeReal2. These are not exactly where the branch mispredictions happened but they’ll lead to where it is coming from. More about how to easily interpret and understand them in the next section.
Precise Events and skid
Note the /ppp specified in the perf record command above. Since BR_MISP_RETIRED.ALL_BRANCHES is a precise event, it can be used to pin-point instruction that is causing such event using PEBS. However, even these events can skid.
From the section, Bad Speculation in Intel Optimization Manual:
The lines with 8.67%, 8.84% are the first instructions in the correct branch path (that was actually taken causing the prediction to go wrong). This means these instruction were not taken during speculative execution. So the fun is to find which branch instruction is this instruction being referred from. It would be much easier for correlation/analysis if the source code was also displayed along with the assembly.
Associate the assembly function with source code
This requires building the source with debug symbols but is worth it. After building with debug symbols, run perf record as specified above with branch misprediction event and then:
$perf annotate -M intel LzmaDec_DecodeReal2
- Press s to toggle source code.
- Press J to show how many branches will make this instruction a target.
- Press k to show the line number in the source code.
- Press h to show help.
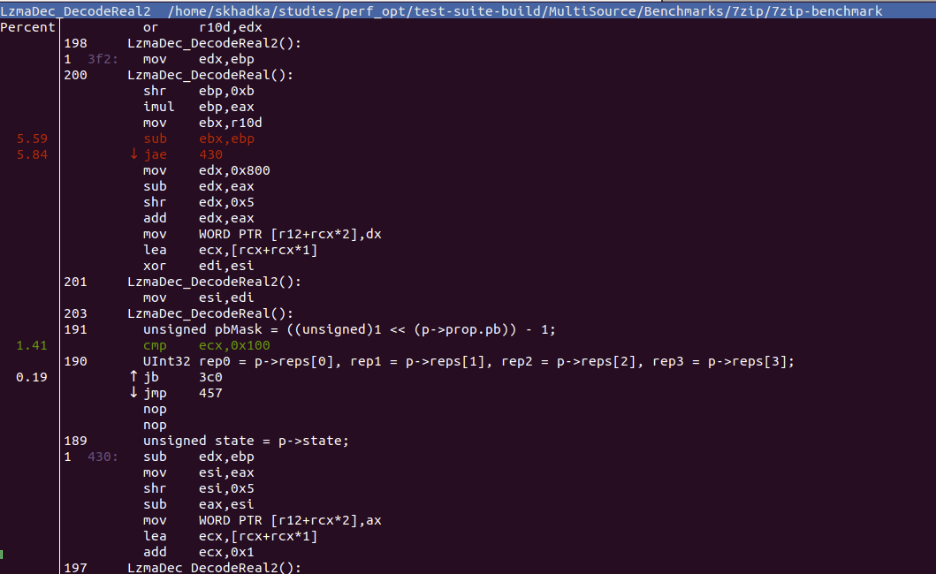 Now that we have source code and assembly, it will be much easier to figure out where in source is the misprediction coming from.
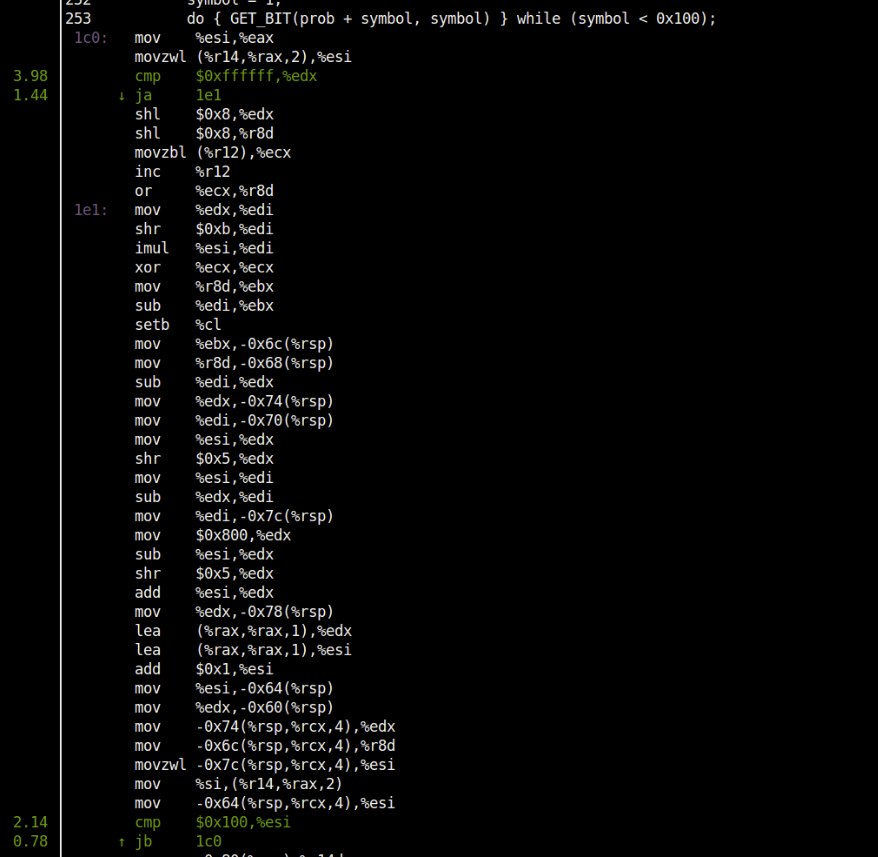
GET_BIT macro with branch misprediction
Using the source code view, I could see that the big branch misprediction % is coming from GET_BIT macro shown in the figure below (See line 179):
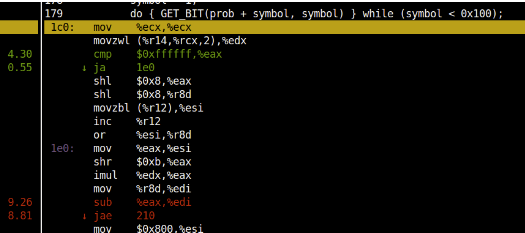
The GET_BIT macro is expanded to the assembly shown above.
The macro has a if(code < bound) condition that maps to the jae instruction which does not have a deterministic pattern leading to mispredictions.

Using lookup table based approach to remove branches
Since the branch is costly, I used lookup table based approach to compute values from both the conditions of the branch and then select the correct value based on the result of comparison operator. This usually leads to generation of CMOV instructions instead of branches.
-#define GET_BIT(p, i) GET_BIT2(p, i, ; , ;)
+
+/*
+This macro is a re-write of GET_BIT2 but does not use conditional if(code<bound)
+This condition is found to cause lots of branch mispredictions
+This condition is replaced into a table-lookup.
+upd_var is the variable to be set to 0th index of upd_vals_table if code>=bound
+upd_var is the variable to be set to 1th index of upd_vals_table if code<bound
+*/
+#define GET_BIT2_AVOID_BRANCH(p, i, upd_var, upd_vals_table) ttt = *(p); \
+    if (range < kTopValue) { range <<= 8; code = (code << 8) | (*buf++); } \
+    bound = (range >> kNumBitModelTotalBits) * ttt;                     \
+    {                                                                   \
+        UInt32 code_table[2] = { code - bound, code};                   \
+        UInt32 range_table[2] = { range - bound, bound};                \
+        unsigned prob_table[2] = { (ttt - (ttt >> kNumMoveBits)) ,      \
+                                   (ttt + ((kBitModelTotal - ttt) >> kNumMoveBits)) \
+        };                                                              \
+        unsigned i_table[2] = { (i + i) + 1, (i + i) };                 \
+        int cond = (code < bound);                                      \
+        range = range_table[cond];                                      \
+        code = code_table[cond];                                        \
+        *(p) = (CLzmaProb) (prob_table[cond]);                          \
+        i = i_table[cond];                                              \
+        upd_var = upd_vals_table[cond];                                 \
+    }
+
+char DUMMY;
+char DUMMY_ARRAY[2] = {'0', '1'};
+
+// GET_BIT defaults to calling AVOID_BRANCH given that almost everything that calls it is inside lots of loops
+// No variable needs to be updated, so set it to some dummy array (although this might add up one more instruction)
+#define GET_BIT(p, i) GET_BIT2_AVOID_BRANCH(p, i, DUMMY, DUMMY_ARRAY)
This brought down the percentage of branch mispredictions to 9.7% instead of 12.5% (from perf stat).
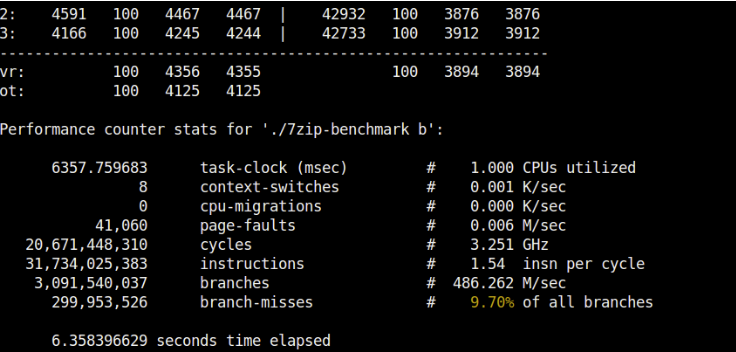
The figure below shows how we eliminated the branch that was causing lots of mispredictions (although I think the number of instructions has increased):